
Jev has been everywhere lately. TypeSafe's new model classifies text and records without any training on your data: you describe the labels in plain language and it picks one. If you build software, work with data, or simply follow the field, the obvious question is how it compares with the classifiers we already know how to train. So I ran a benchmark of TypeSafe's Jev against trained classifiers on three public datasets with known labels.
I had a second reason. In the coverage I followed, the demos showed Jev's right answers, which is what demos are for. I saw less of a point that holds for every classifier, Jev and the models I compared it with alike: none of them is perfect. Once you know how accurate a model is, the next question is how it fails and whether you can spot the failures. This article covers both, in that order.
What Jev is, and who else is in this test
Jev is the first model in a class TypeSafe calls System One models, in early access since 15 September 2026. Instead of writing text, it fills in a schema you declare. You name the labels, describe each in a sentence, and it returns one choice with a confidence score. Nothing is trained on your data, which is what makes it zero-shot. The line-up below shows all ten contenders in two arenas. Besides Jev, they are trained models, a second zero-shot model, and a deliberately humble baseline: a one-line rule that flags a bank customer if the last campaign succeeded.
Hover, focus or tap a contender for its facts and official page.
 JevZero-shotSystem One model · a decision model, not a text generator
- What it is
- You declare labels in a typed schema. It returns one choice plus a confidence score, and no free text.
- Size
- Architecture and size are not published.
- In this test
- Label descriptions only, no task training. Local Docker deployment
typesafe/jev-1.13-20260917, three repeats per cohort.
 DeBERTaFine-tunedTransformer encoder (a neural network), fine-tuned end to end
- Not this
- Not a sentence-transformer. It is not trained to produce sentence embeddings, and its own weights are updated for the task.
- Size
- 6 layers, hidden size 768: 44M backbone parameters plus a 98M-parameter embedding layer.
- In this test
microsoft/deberta-v3-smallwith a classification head, fine-tuned on the labelled rows. Three epochs, batch size 8, five seeds on intent, tuned on sentiment.
 MiniLM + logisticTrainedSentence-transformer, frozen, plus a trained linear head
- Base model
all-MiniLM-L6-v2: a 22.7M-parameter sentence-transformer built on MiniLM-L6-H384 and fine-tuned on over a billion sentence pairs. It maps text to a 384-dimension vector.- How the two interact
- The transformer never updates. It turns each message into a vector, and a logistic-regression head is the only part trained on the labels.
- In this test
- Trained on the same labelled rows as DeBERTa.
 TF-IDF + logisticTrainedClassical machine learning · no neural network
- How it works
- Counts words and two-word phrases, weights each by how rare it is across messages (TF-IDF), then fits a logistic regression on those weights.
- In this test
- The leanest trained baseline: word 1 to 2 grams, trained on the same labelled rows.
 fastTextTrainedShallow neural network
- How it works
- Averages learned word and character n-gram vectors into one text vector, then applies a linear classifier.
- In this test
- Supervised fastText trained on the labelled rows. No transformer and no pretrained language model.
 Local NLIZero-shotTransformer fine-tuned for entailment · zero-shot
- Base model
- DeBERTa-v3-base (about 0.2B parameters), fine-tuned by Moritz Laurer on 33 datasets and 387 classes.
- How it classifies
- Turns each label into a hypothesis, such as "This example is about billing", and scores whether the text entails it.
- In this test
- Runs locally with no task training. On CLINC150 it never predicted out-of-scope.
- JevZero-shotSystem One model · reads one row at a time
- What it is
- The same model as in Arena 1, given 19 pre-contact fields per customer and no population statistics.
- In this test
- Row-only instructions, eight rows per call, three repeats per cohort. Its labels matched the one-line rule on 1,998 of 2,000 rows.
 Logistic regressionTrainedLinear model · classical machine learning
- How it works
- Weighs each of the 19 customer fields and squeezes the total through a sigmoid into a probability.
- In this test
- Class-balanced weights, with the decision threshold chosen on development rows.
 Random forestTrainedEnsemble of decision trees
- How it works
- Grows many trees, each on a random sample of the rows. The forest votes.
- In this test
- 300 trees on balanced subsamples, with the threshold chosen on development rows.
 Gradient boostingTrainedBoosted decision trees
- How it works
- Adds small trees one at a time, each trained to correct the errors of those before it.
- In this test
- Histogram gradient boosting, 250 iterations, balanced weights. The strongest table model at 0.731 macro-F1.
 The one-line ruleNo modelNo model · a deliberately simple baseline
- The rule
poutcome == success: flag the customer if the last campaign succeeded.- In this test
- Scores 0.608 macro-F1 against Jev's 0.605, and Jev's answers matched it on 1,998 of 2,000 rows.
- The referee's rule
Same rows and same care for everyone.
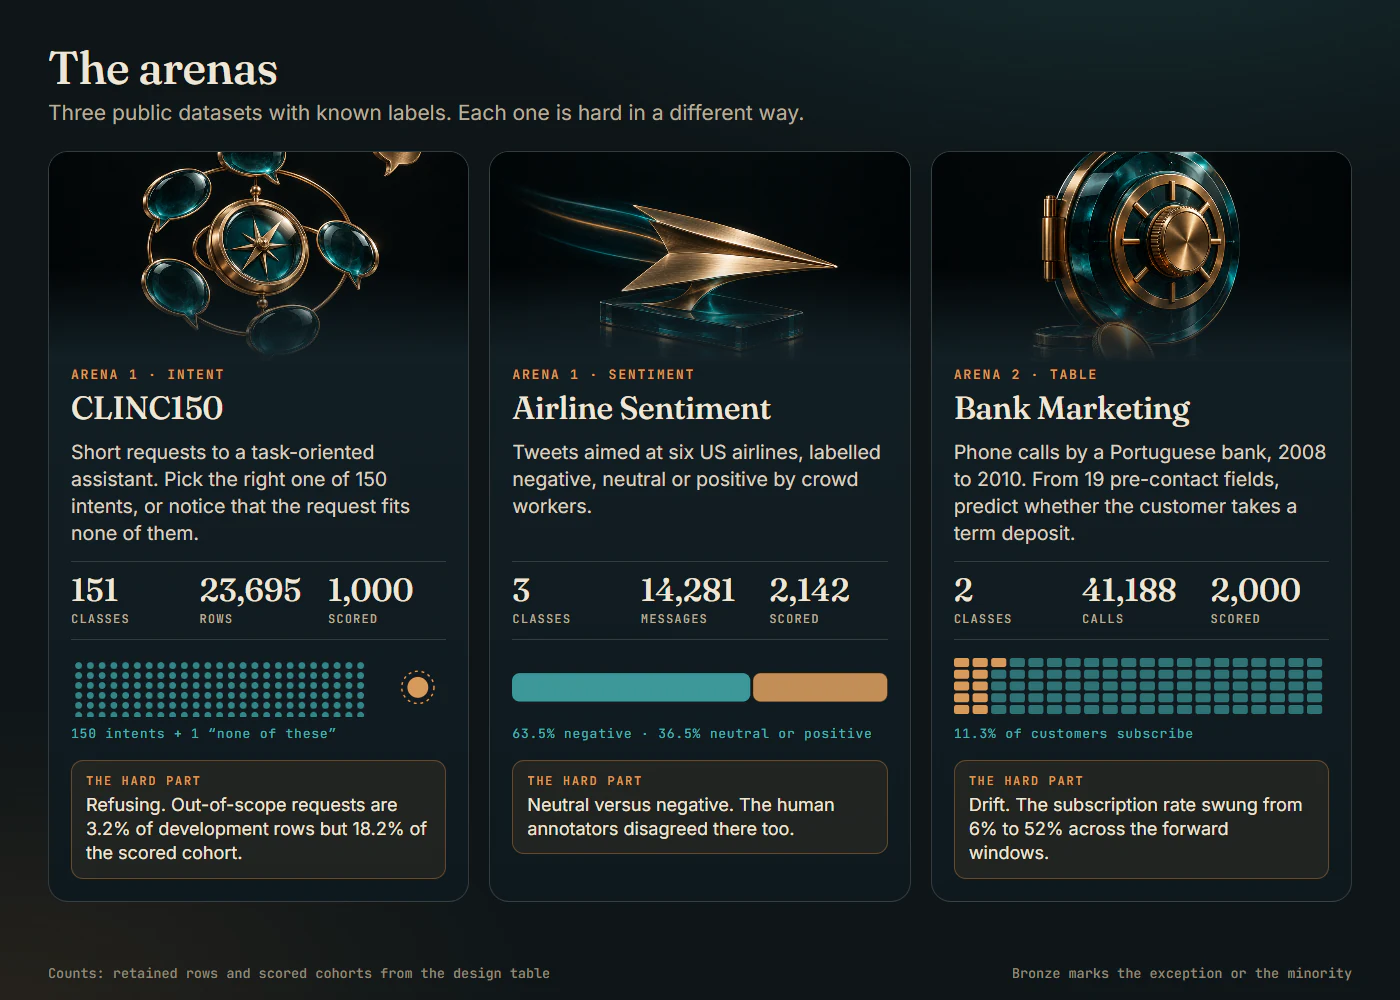
They play on three public datasets with known labels. Figure 1 gives the size and hard part of each.
TypeSafe's launch post claims speed, low cost and calibrated confidence, meaning that a higher confidence score should track a higher chance of being right (TypeSafe AI, 2026). Its headline benchmark scores Jev against the average answer of two other frontier models, not against labelled ground truth, and the post says so. Independent write-ups noted the same limit (Maio, 2026; TrueFoundry, 2026; Awan, 2026).
Others have started testing. MindStudio (2026) ran Jev against trained BERT-style classifiers on four datasets and found the trained models ahead on three, with Jev's average confidence at 88% against roughly 80% accuracy on Banking77. My accuracy results point the same way. In the independent write-ups I read, none fixed an error budget in advance, chose the confidence threshold on separate data, and checked that it held on unseen rows. That is the test here.
I have no commercial relationship with TypeSafe AI. I ran everything on my own hardware against a local Docker deployment of Jev (typesafe/jev-1.13-20260917), on public datasets only. I used Claude as an adversarial reviewer of my first-round reports and checked each objection against the data.
What I found
Jev never beat the strongest trained comparator on the primary metric, and it tied one. Five results carry the argument.
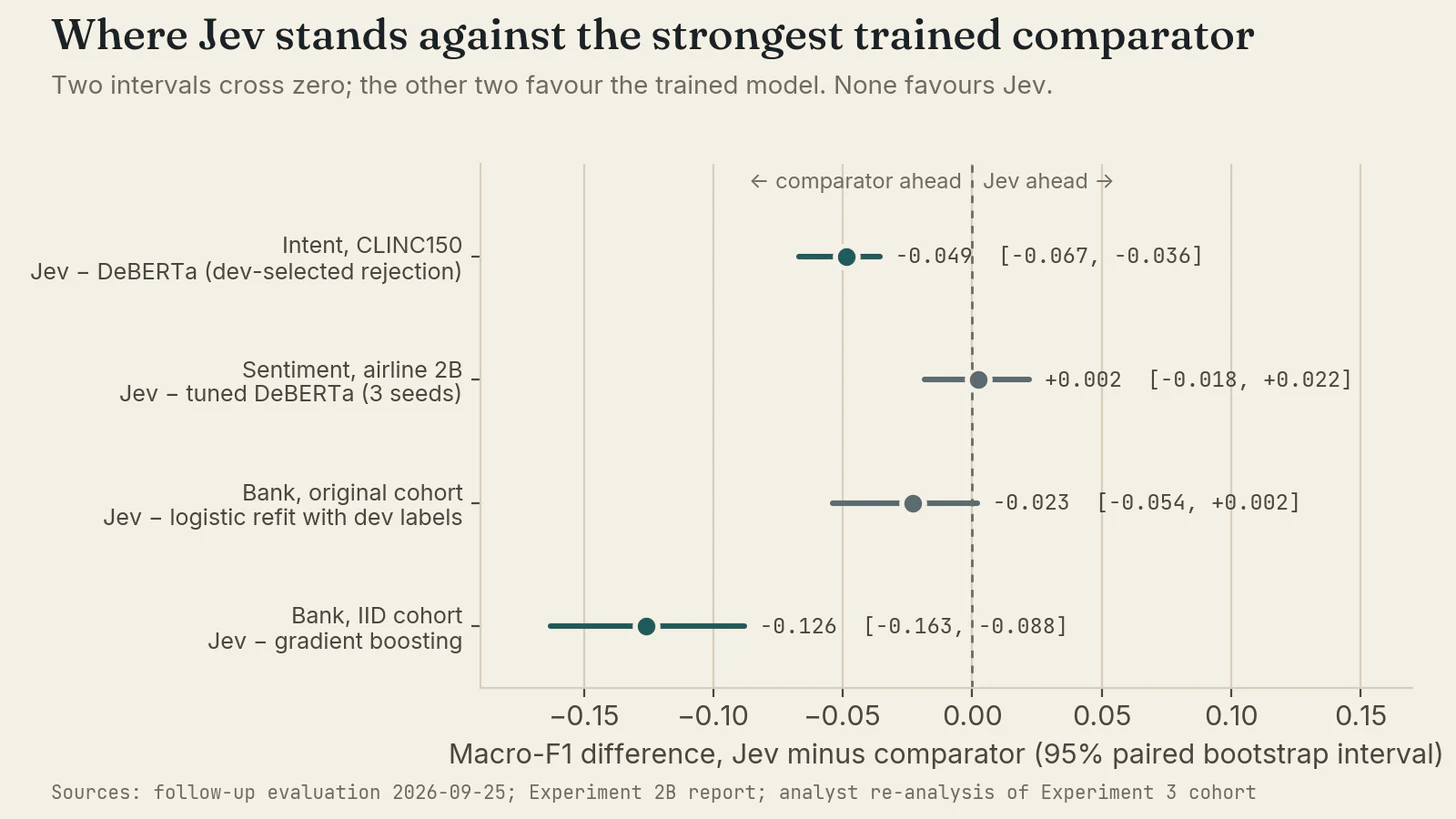
- Intent (CLINC150). Fine-tuned DeBERTa beat Jev by 0.049 macro-F1 (95% interval 0.036 to 0.067) and by 6.6 points on known-intent accuracy. Jev refused unsupported requests 20.9 points more often.
- Sentiment (airline tweets). Jev and a tuned DeBERTa were indistinguishable (difference +0.002, interval −0.018 to +0.022), and Jev needed no labels.
- Bank subscription (customer table). Trained models beat Jev by 0.109 to 0.126 macro-F1, and about 500 labelled rows were enough for gradient boosting to pass it. Jev's answers matched the rule "last campaign succeeded" on 1,998 of 2,000 rows.
- Repeatability. Jev gave the same label on 98.5% to 98.7% of sentiment messages across runs. Tuned DeBERTa seeds agreed on 93.9% to 95.1%.
- Errors. On text, Jev's confidence separated its wrong answers from its right ones (error-detection AUC 0.81 to 0.83). A cut-off fixed on development data automated 64.8% of unseen sentiment messages at 4.6% error and sent 81% of the errors to review. On bank data the same signal scored 0.512, which is chance.
The key findings are also available as a ten-slide PDF.
A zero-shot model that matches your baseline has solved a labelling problem, not an accuracy problem.
How I tested it
This is a set of benchmark comparisons, not a controlled experiment. The contenders differ in what they receive (labels or label descriptions), in tuning effort, and in how their decision rule is set, and I treat each difference as part of the question. Within an experiment every contender scored exactly the same test rows, so paired comparisons are valid, but scores are not comparable across experiments. Table 1 lists the data.
Table 1. Datasets, splits and scored cohorts
| Item | Experiment 1: intent | Experiment 2: sentiment | Experiment 3: bank subscription |
|---|---|---|---|
| Source | CLINC150 (Larson et al., 2019) | Twitter US Airline Sentiment, Kaggle v4 (CrowdFlower, 2015) | UCI bank-additional-full.csv (Moro et al., 2014) |
| Task | 150 intents + out-of-scope (151 classes) | negative / neutral / positive | subscribed / not subscribed |
| Retained rows | 23,695 (5 duplicated training texts removed) | 14,281 messages from 7,658 author groups | 41,188 source rows; 19 pre-contact inputs (duration removed) |
| Train / development / test | 15,095 / 3,100 / 5,500 (published split) | 9,997 / 2,142 / 2,142 (author-disjoint) | IID: 24,714 / 8,237 / 8,237; forward: five rolling origins |
| Scored cohort | 1,000 test rows: 818 known, 182 out-of-scope | 1,000 test (first round); 2,142 development (follow-up) | 1,200 test (first round); 2,000 IID test; 5 × 600 forward |
| Jev runs | 3 repeats | 1 (first round), 3 (follow-up) | 1 per arm (first round); 3 per cohort (follow-up, 18 runs) |
Jev received the most careful design of any contender: named labels, one-sentence descriptions, task instructions and, for intent, an explicit out-of-scope option. I count that as tuning. I gave the trained models comparable care, listed in Table 2: rejection thresholds for intent, hyperparameters chosen on training data only for sentiment, and class weights, development-selected thresholds and rule baselines for bank data.
Table 2. Contenders by experiment
| Family | Intent and sentiment | Bank subscription |
|---|---|---|
Jev (typesafe/jev-1.13-20260917) | Typed schema with plain-language label descriptions; intent schema includes an explicit out-of-scope label; no task training | Row-only instructions, 19 fields, no population statistics; eight rows per call |
| Fine-tuned transformer | DeBERTa-v3-small (He et al., 2021), 3 epochs, batch size 8; 5 seeds (intent); sentiment adds learning-rate and epoch selection on a grouped holdout inside the training split | Not used |
| Frozen embedding + linear head | all-MiniLM-L6-v2 + logistic regression | Not used |
| Classical text | TF-IDF (word 1 to 2 grams) + logistic regression; fastText | Not used |
| Local zero-shot NLI | deberta-v3-base-zeroshot-v1.1-all-33 (Laurer et al., 2023) | Not used |
| Tabular supervised | Not used | Class-balanced logistic regression; random forest (300 trees, balanced subsamples); histogram gradient boosting (250 iterations, balanced weights) |
| Rules | Not used | poutcome == success (last campaign succeeded); pdays < 999 (contacted before) |
The primary metric is macro-F1, the unweighted mean of per-class F1, because accuracy rewards guessing the majority class when classes are uneven. Intervals are 95% percentile intervals from 1,000 paired bootstrap resamples of the frozen cohort. They describe sampling of test rows, not training-seed variance or a new population, and I applied no multiple-comparison correction, so I treat the contrasts as descriptive.
The five questions
- Intent Does Jev's explicit fallback label beat thresholded fine-tuned models at detecting out-of-scope requests?
- Sentiment Is Jev distinguishable from a tuned DeBERTa?
- Bank labels How much do labels add on bank data, and how many does it take?
- Shift Does any method hold up as prevalence and economic conditions change?
- Errors When Jev is wrong, do its confidence or its disagreement with a trained model flag the error well enough to route it to review?
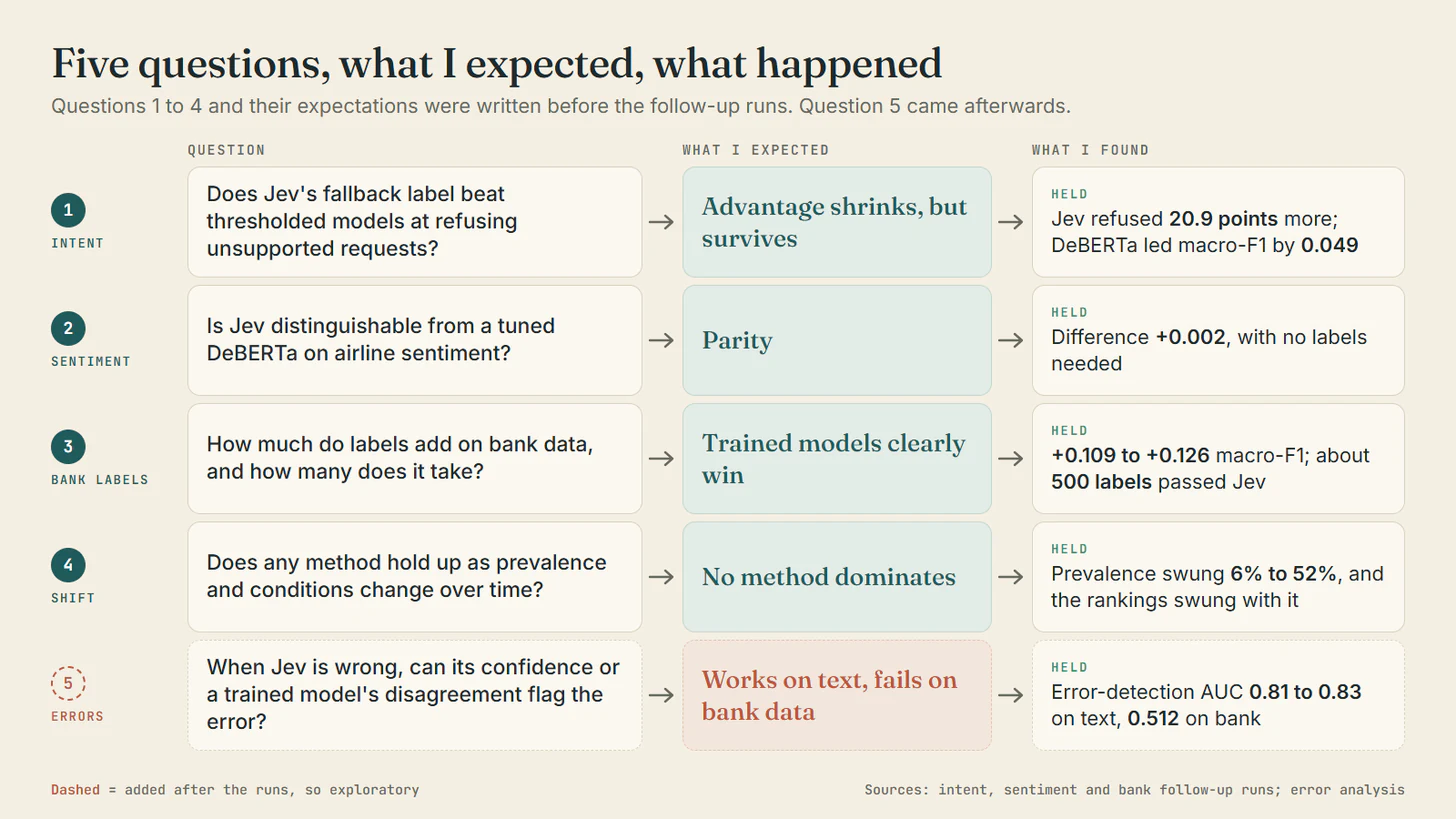
I wrote down my expectations for the first four before the follow-up runs. The fifth came afterwards, when I noticed that no contender reached perfect recall, so that analysis is exploratory except where I fixed a threshold on development data before it touched the test set. Figure 3 sets each question beside what I expected and what happened.
My first-round results were wrong in three ways, and each one flattered Jev. Jev's schema had an explicit out-of-scope option while the trained models had no rejection threshold. One untuned DeBERTa seed stood in for the trained side of the sentiment test. And the bank split put every test value of the three-month Euribor rate outside the training range while leaving thousands of development labels unused. I found these by asking Claude to attack my reports, then checked each objection against the data. One objection overreached, and the intent section says which. Every number below comes from the follow-up runs that answered the review.
Each official run needed a clean committed revision and a preflight bound to dataset, task and cohort hashes, and every prediction went into an append-only journal before the run counted. Failed attempts stayed as typed failure artifacts.
Intent: Jev refuses better and answers worse
In the first round, fine-tuned DeBERTa led on macro-F1 (0.914 against Jev's 0.879) and Jev led on refusals (76.9% of out-of-scope requests against 41.8%). The refusal column looked like Jev's clearest win, and it was not a fair one. Jev's schema carried an explicit label for "the request does not match any supported intent". The trained models could say "none" only by predicting a class learned from 100 training examples, 0.7% of their data, with no confidence threshold, although the literature treats a threshold as the standard baseline (Hendrycks & Gimpel, 2017; Larson et al., 2019). Table B1 has the first-round numbers.
Two properties of Jev held up even so. Its three repeats gave identical labels on 98.6% of rows, while five DeBERTa seeds agreed on 84%. And it beat the only other label-free option, a local NLI model, which never predicted out-of-scope at all.
With a rejection threshold chosen on development data, DeBERTa beat Jev on everything except refusals. Jev still caught 20.9 points more out-of-scope requests.
Table 3. Intent follow-up: same-fit models with development-selected rejection thresholds
| Model | Development threshold | Test macro-F1 before → after | Known-intent accuracy | Out-of-scope recall | False out-of-scope alarms (of 818) |
|---|---|---|---|---|---|
| DeBERTa seed 0 | 0.489 | 0.910 → 0.916 | 96.3% | 45.1% | 8 |
| DeBERTa seed 17 | 0.456 | 0.916 → 0.927 | 96.7% | 56.0% | 4 |
| DeBERTa seed 41 | 0.642 | 0.915 → 0.934 | 96.6% | 61.5% | 14 |
| DeBERTa seed 73 | 0.569 | 0.916 → 0.936 | 96.7% | 64.3% | 9 |
| DeBERTa seed 101 | 0.490 | 0.910 → 0.924 | 96.8% | 53.3% | 1 |
| DeBERTa, five-seed mean | 0.927 | 96.6% | 56.0% | 7.2 | |
| MiniLM + logistic | 0.087 | 0.886 → 0.901 | 94.9% | 47.3% | 6 |
| Jev, three-repeat mean | not applicable | 0.879 | 90.0% | 76.9% | 12.7 |
Paired bootstrap, DeBERTa minus Jev: macro-F1 +0.049 [+0.036, +0.067]; known-intent accuracy +6.6 points [+5.1, +8.1]; out-of-scope recall −20.9 points [−27.5, −13.5]. All three intervals exclude zero.
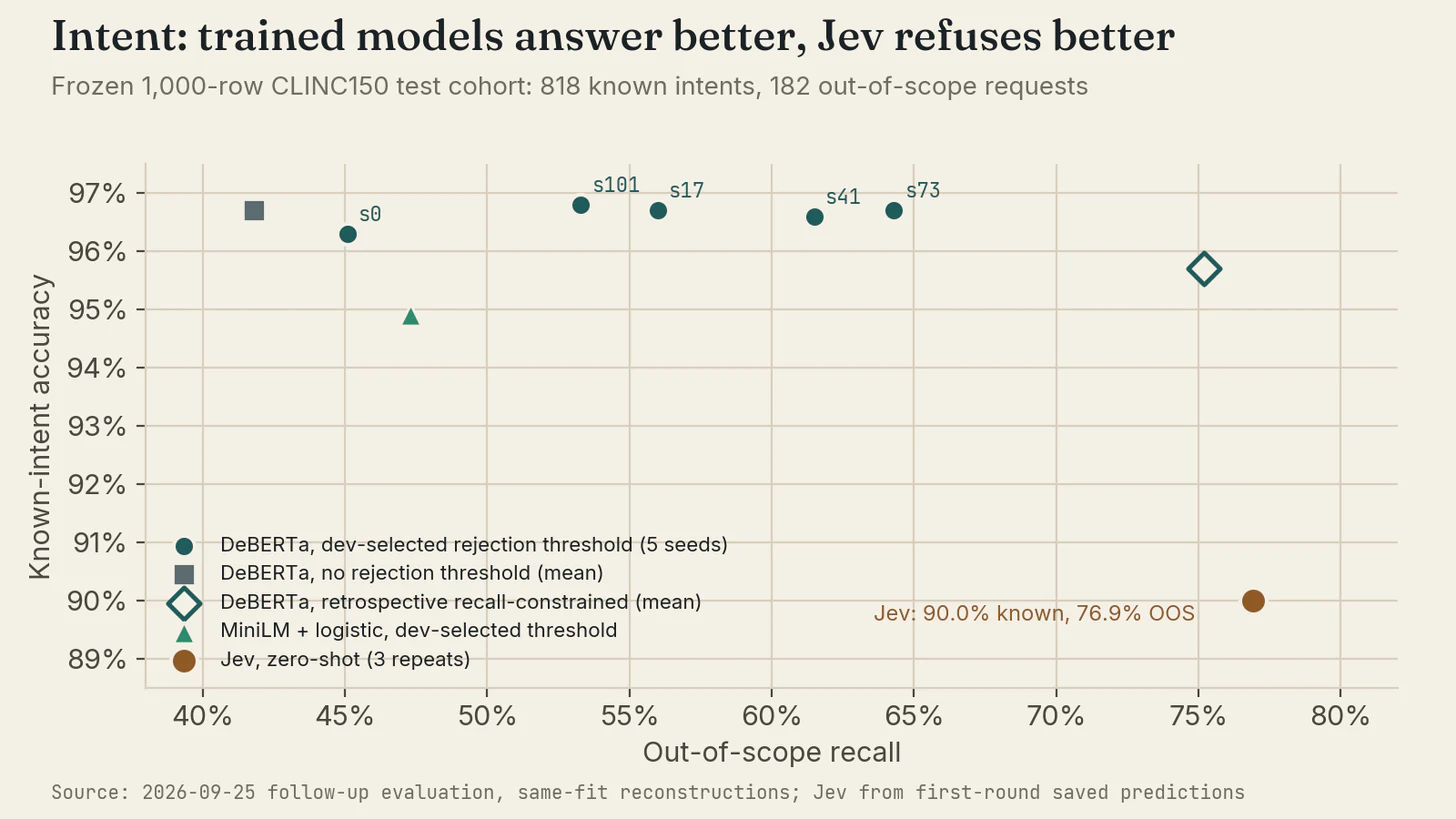
The threshold objective explains why the gap did not close. Maximising overall development accuracy on a split that is 3.2% out-of-scope rewards answering, not refusing. A retrospective analysis that set each threshold to hit Jev's 76.9% recall gave the five seeds 0.943 macro-F1 and 75.2% recall (Table B2). Because the target came from an already-examined result, it shows what a different business loss could buy, not who wins.
One correction to my own review belongs here. Before these runs I estimated thresholds by cross-fitting on halves of the test cohort, and that diagnostic suggested DeBERTa would beat Jev on both axes at once. The procedure I had committed to in advance did not reproduce it, because the cross-fitted estimate was tuned to a cohort with 18.2% out-of-scope requests and the development set has 3.2%. The gap is a threshold-policy question, and under the policy I set in advance, Jev refuses better.
Sentiment: a dead heat with no labels
On 2,142 untouched, author-disjoint messages, three Jev repeats and three tuned DeBERTa seeds were statistically indistinguishable. Table B3 has the first-round comparison, where Jev's small lead over a single DeBERTa was also within noise.
Table 4. Sentiment follow-up on 2,142 development messages
| Run | Macro-F1 | Accuracy | Negative / neutral / positive recall | Selected settings |
|---|---|---|---|---|
| DeBERTa default, seed 0 | 0.794 | 84.7% | 0.924 / 0.694 / 0.740 | 3 epochs, fixed |
| DeBERTa tuned, seed 0 | 0.795 | 84.9% | 0.929 / 0.676 / 0.754 | lr 2e-5, 3 epochs |
| DeBERTa tuned, seed 17 | 0.800 | 85.0% | 0.915 / 0.730 / 0.746 | lr 2e-5, 2 epochs |
| DeBERTa tuned, seed 41 | 0.803 | 85.3% | 0.924 / 0.708 / 0.760 | lr 1e-5, 2 epochs |
| Jev, repeat 1 | 0.800 | 84.6% | 0.906 / 0.710 / 0.781 | none |
| Jev, repeat 2 | 0.803 | 84.7% | 0.905 / 0.712 / 0.790 | none |
| Jev, repeat 3 | 0.802 | 84.6% | 0.906 / 0.708 / 0.790 | none |
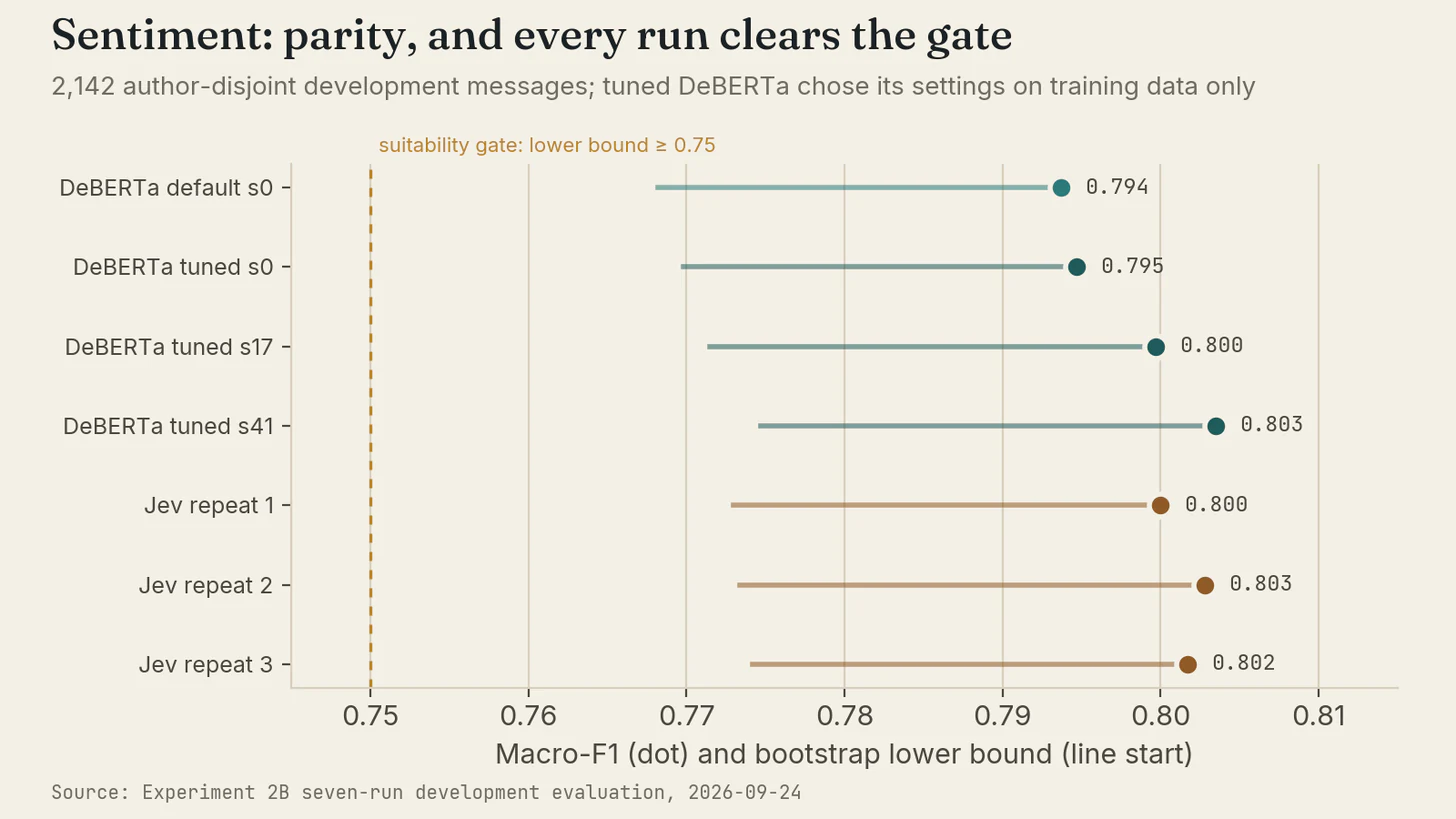
Jev's mean minus the tuned-DeBERTa mean was +0.002 [−0.018, +0.022]. All nine run-pair intervals crossed zero, with point differences from −0.008 to +0.004. Tuning moved DeBERTa by about 0.005 over the default and took 22 to 31 minutes per seed, against about 5 minutes for the default and about 1 minute per Jev repeat.
The two models share the same weaknesses. On the 315 messages where annotators agreed at most two-thirds of the time, accuracy fell to 0.64 to 0.65 for DeBERTa and 0.61 to 0.62 for Jev. On the 116 messages of five tokens or fewer, Jev was weaker (0.77 to 0.78 against 0.83 to 0.86). I also checked whether batching eight tweets per call let neighbours nudge each other's labels, and found no evidence that it did.
Bank subscription: Jev found one rule, and 500 labels beat it
The first-round bank result, Jev at 0.618 macro-F1 against 0.38 to 0.48 for the supervised models, was an artefact of the split. The supervised models ranked customers at close to chance (ROC AUC 0.524 to 0.587), and the chronological split was an extreme shift: every test value of the three-month Euribor rate lay outside the training range, and subscriber prevalence rose from 5.6% in training to 38.4% in test. A threshold chosen under one prevalence misplaces the boundary under another (Saerens et al., 2002). Tables B4 and B5 have the first-round arms.
The follow-up used two corrected tracks built from a byte-identical copy of the raw file. Track A is same-distribution (called IID in some figures): a stratified, group-aware 60/20/20 split where identical rows never straddle splits and prevalence is 11.3% in every split. Track B is forward in time: five rolling origins at 50% to 90% of the date-ordered file, each trained on earlier rows, thresholded on the next 5% block, and scored on a frozen 600-row cohort from the block after that.
On the same-distribution split, every trained model beat Jev by a wide, clear margin, and Jev performed exactly like the rule.
Table 5. Bank subscription, same-distribution track: 2,000 frozen test rows, 225 subscribers
| Arm | Macro-F1 | ROC AUC | Average precision | Precision / recall | Flag rate | TN / FP / FN / TP |
|---|---|---|---|---|---|---|
| All negative | 0.470 | n/a | n/a | 0 / 0 | 0.0% | 1775 / 0 / 225 / 0 |
| Rule: last campaign succeeded | 0.608 | n/a | n/a | 0.554 / 0.182 | 3.7% | 1742 / 33 / 184 / 41 |
| Rule: contacted before | 0.622 | n/a | n/a | 0.553 / 0.209 | 4.3% | 1737 / 38 / 178 / 47 |
| Jev, row only (3 repeats, identical labels) | 0.605 | 0.534 | 0.204 | 0.556 / 0.178 | 3.6% | 1743 / 32 / 185 / 40 |
| Logistic regression | 0.714 | 0.790 | 0.427 | 0.464 / 0.538 | 13.1% | 1635 / 140 / 104 / 121 |
| Random forest | 0.726 | 0.785 | 0.436 | 0.492 / 0.547 | 12.5% | 1648 / 127 / 102 / 123 |
| Gradient boosting | 0.731 | 0.798 | 0.433 | 0.480 / 0.591 | 13.9% | 1631 / 144 / 92 / 133 |
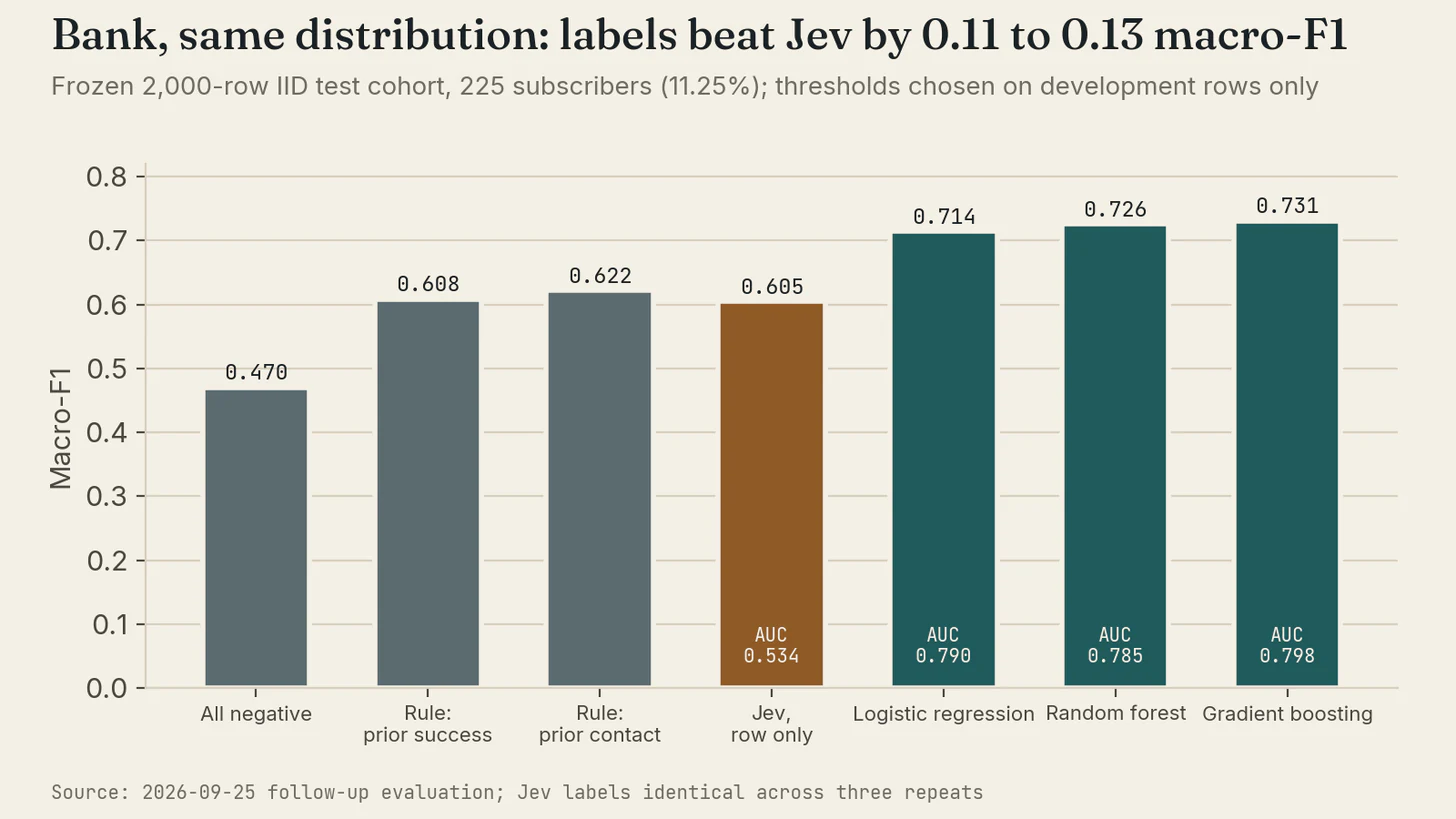
Paired differences, trained model minus Jev: logistic +0.109 [+0.074, +0.145], forest +0.121 [+0.085, +0.159], boosting +0.126 [+0.088, +0.163]. Five seeds each put the forest between 0.720 and 0.732 and boosting between 0.720 and 0.731, so every checked seed beat Jev. The rule minus Jev was +0.002 [−0.001, +0.009]. Jev's three repeats produced identical labels, and those labels matched the prior-success rule on 1,998 of 2,000 rows.
Jev's precision at its own flag rate, 0.556, looks respectable, but it describes a narrow trigger, not a good ranking (AUC 0.534). When every method may contact the same share of customers, the gap becomes plain.
Table 6. Precision and recall at fixed contact budgets, same-distribution cohort
| Budget (customers contacted) | Jev precision | Jev recall | Boosting precision | Boosting recall |
|---|---|---|---|---|
| Top 10% (200) | 0.260 | 0.231 | 0.485 | 0.431 |
| Top 18% (360) | 0.175 | 0.280 | 0.392 | 0.627 |
| Top 30% (600) | 0.133 | 0.356 | 0.262 | 0.698 |
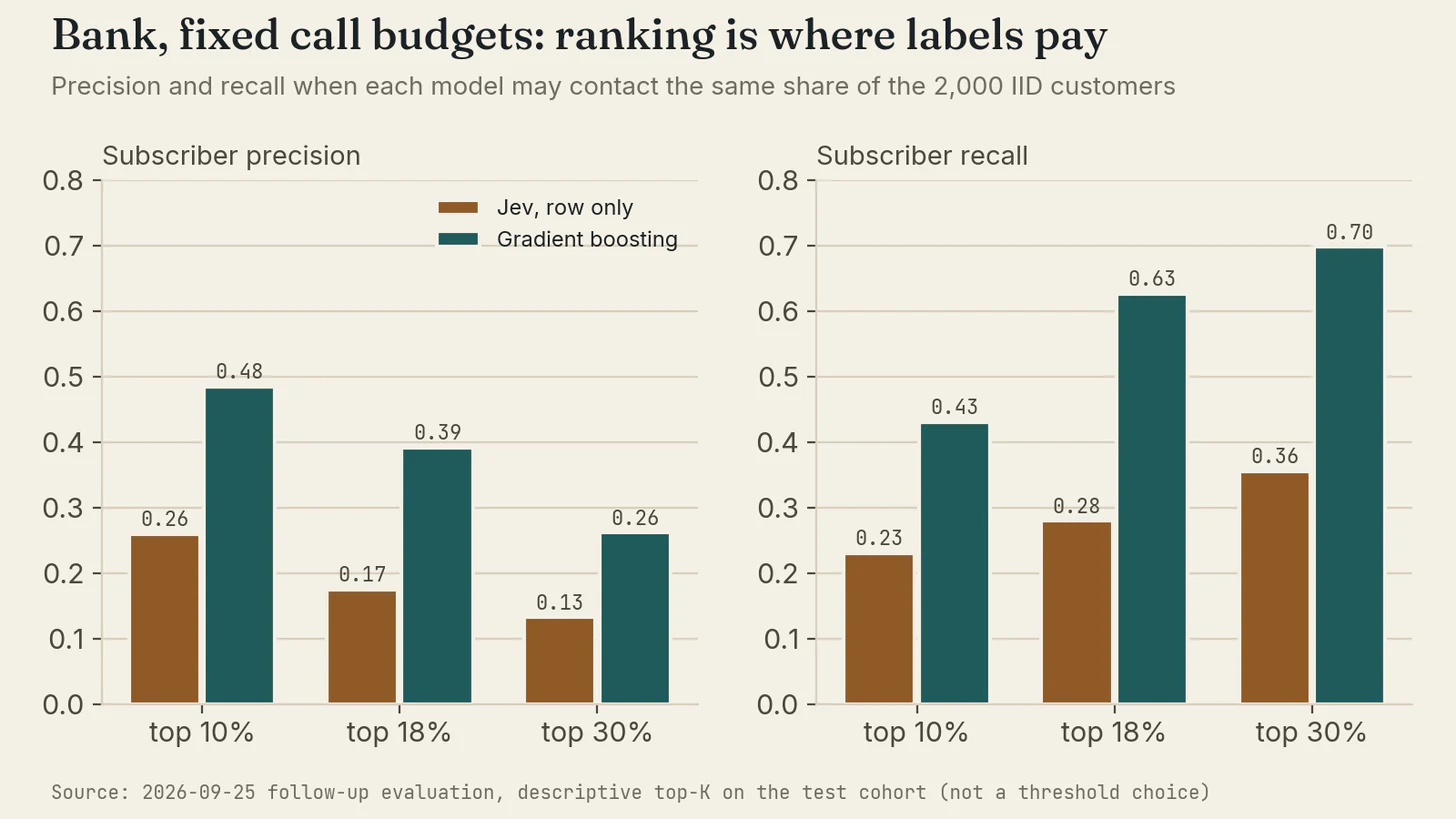
About 500 labelled rows were enough for gradient boosting to pass row-only Jev on this split. I fitted gradient boosting on random samples of the training and development pool, five samples per size, chose each threshold from out-of-fold predictions on the sampled labels alone, and scored every fit on the same 2,000-row cohort.
Table 7. Label learning curve, gradient boosting on the same-distribution cohort (mean of five samples; range in brackets)
| Labelled rows | Macro-F1 | ROC AUC |
|---|---|---|
| 50 | 0.554 [0.510, 0.599] | 0.643 |
| 100 | 0.581 [0.508, 0.628] | 0.690 |
| 200 | 0.591 [0.579, 0.603] | 0.693 |
| 500 | 0.635 [0.623, 0.642] | 0.732 |
| 1,000 | 0.653 [0.640, 0.672] | 0.740 |
| 2,000 | 0.657 [0.633, 0.675] | 0.737 |
| 5,000 | 0.693 [0.680, 0.703] | 0.764 |
| 10,000 | 0.717 [0.709, 0.725] | 0.774 |
| 32,951 (all) | 0.732 | 0.798 |
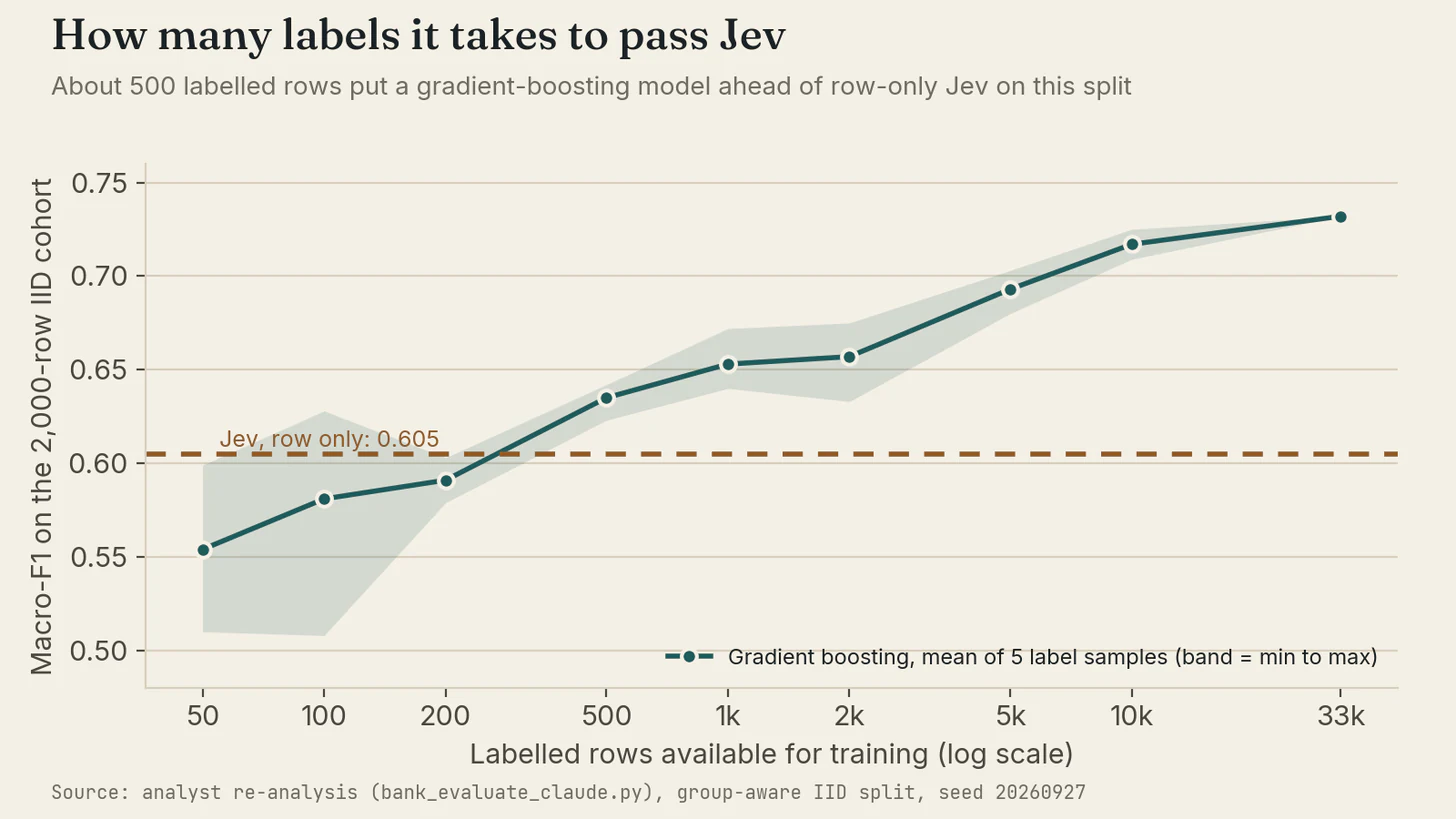
On ranking quality the crossing comes earlier: 50 labels already gave AUC 0.643 against Jev's 0.534. This curve comes from my own re-analysis script, and the same-distribution split lets the macro-economic columns carry calendar information, so treat it as an upper bound for a deployed model.
Under forward-in-time evaluation, no method won reliably. Jev and the prior-success rule moved together because they are nearly the same classifier.
Table 8. Bank subscription, forward track: macro-F1 by rolling origin (600 rows each)
| Origin | Test prevalence | Jev (3-repeat mean) | Rule: prior success | Logistic | Random forest | Boosting | Jev subscriber recall |
|---|---|---|---|---|---|---|---|
| 50% | 6.0% | 0.510 | 0.510 | 0.479 | 0.509 | 0.476 | 2.8% |
| 60% | 15.3% | 0.466 | 0.466 | 0.458 | 0.457 | 0.466 | 1.1% |
| 70% | 5.7% | 0.528 | 0.528 | 0.485 | 0.493 | 0.478 | 5.9% |
| 80% | 23.5% | 0.555 | 0.554 | 0.576 | 0.578 | 0.545 | 15.6% |
| 90% | 52.2% | 0.616 | 0.636 | 0.584 | 0.391 | 0.536 | 42.8% |
| Mean | 0.535 | 0.539 | 0.516 | 0.485 | 0.500 |
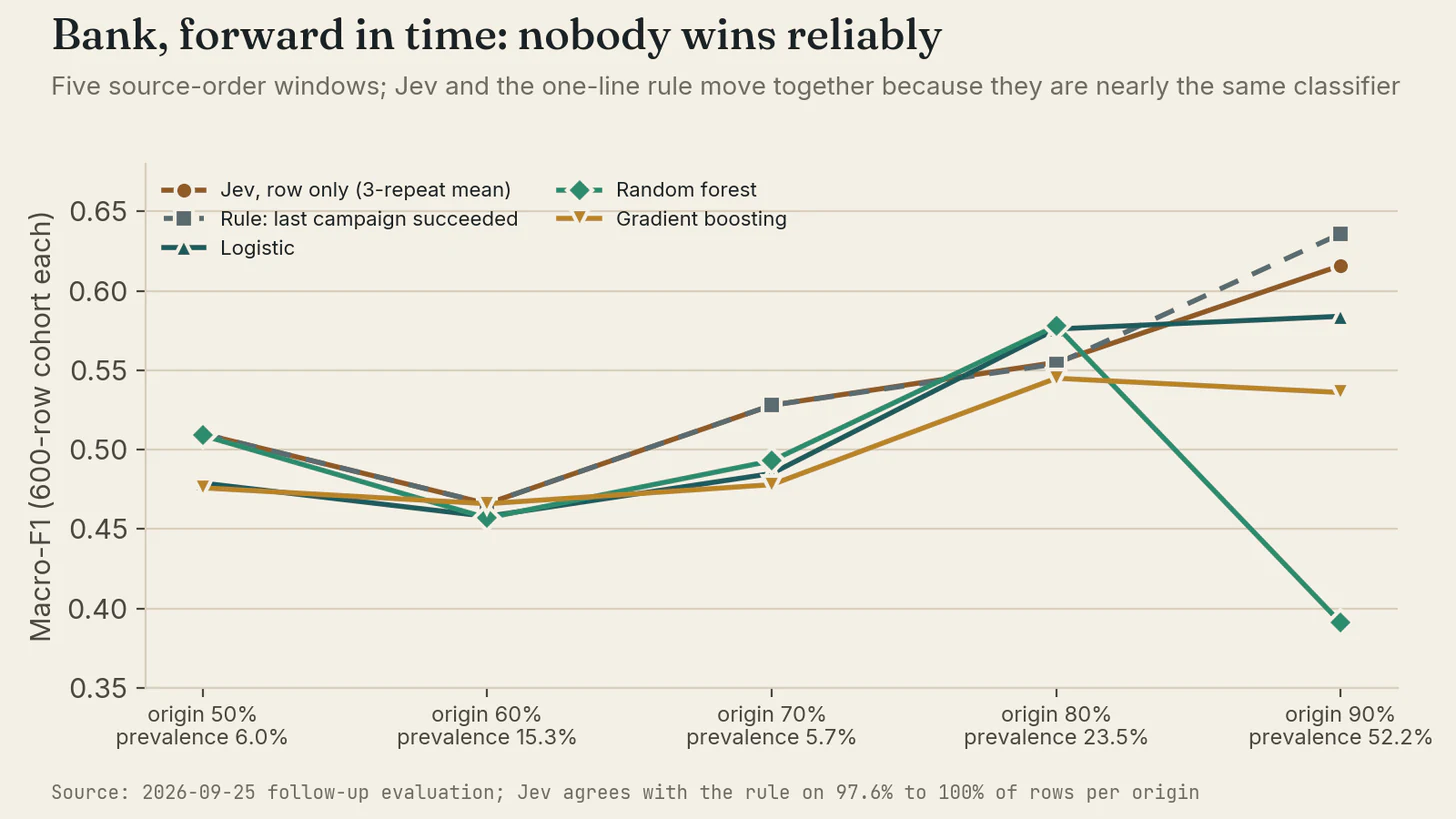
Jev's labels matched the rule on 100% of rows at the first three origins, 99.9% at the fourth and 97.6% at the fifth, and at the first three it found at most 6% of subscribers. Its confidence AUC by origin was 0.387, 0.501, 0.519, 0.548 and 0.662. The supervised fits were weak too, and training only on recent history helped the forest but hurt logistic regression (Table B6).
What Jev gets wrong, and whether you can find it
Every classifier is wrong some of the time, so the useful questions are how often, on what, and whether anyone can tell which answers to distrust. Percentages hide the size of the pile. Table 9 multiplies five error rates by three volumes. The first two rows are illustrative arithmetic, and the last three are Jev's measured error rates on my frozen test cohorts, one per task.
Table 9. Wrong answers at three volumes, by error rate
| Error rate | 10,000 records | 100,000 records | 1,000,000 records |
|---|---|---|---|
| 1% (illustrative) | 100 | 1,000 | 10,000 |
| 4% (illustrative) | 400 | 4,000 | 40,000 |
| 10.8% (Jev, bank subscription) | 1,080 | 10,800 | 108,000 |
| 12.1% (Jev, intent) | 1,210 | 12,100 | 121,000 |
| 15.7% (Jev, airline sentiment) | 1,570 | 15,700 | 157,000 |
TypeSafe's launch post states the stakes itself. It argues that a model that is right 95% of the time but cannot say which 5% it missed cannot automate a task, and it offers Jev's calibrated confidence as the fix (TypeSafe AI, 2026). That is the claim this section tests. If confidence ranks wrong answers below right ones, a team can send the doubtful answers to a person and automate the rest. If it does not, the pile stays in the output.
That turns a modelling question into a staffing question. Someone must own the answers that go to review, and someone must sample the answers that do not. I call the rule that divides them an error budget: the most wrong answers a team will accept in the work nobody checks.
Accuracy tells you how many answers are wrong. It does not tell you which ones.
Jev is wrong on a predictable share of items in every task tested, and on text its own confidence is a usable signal for finding them. On tabular data it is not. I use the vocabulary of selective classification, which lets a classifier decline to decide (Chow, 1970; Geifman & El-Yaniv, 2017). Each item is either automated, meaning Jev's label is accepted, or routed to review.
- Coverage. The share of items automated.
- Selective risk. The error rate among the automated items.
- Error capture. The share of all Jev errors that land in the review pile.
- Error-detection AUC. How well a signal separates Jev's wrong answers from its right ones, where 0.5 is no better than chance.
I compared two triage signals. The first is Jev's own confidence: automate an item only when its top-label confidence reaches a threshold. The second is disagreement with a trained model: automate only when Jev and the strongest trained comparator agree. Agreement has no parameter, so it can be scored directly on the test cohort. A confidence threshold must be chosen before it touches the test set, and my target was the lowest threshold that kept selective risk at or below a 5% error budget. For sentiment I chose it on Jev's 2,142 development predictions, then applied it once to the 1,000 first-round test messages, the one prospective error-handling result in the study. Jev was never run on the CLINC150 development split, so I cross-fitted the intent threshold over 300 random halvings of the test rows, which makes it an interim estimate. For bank data I report only the error-detection AUC, because there was no signal to threshold.
Error types
Table 10. Jev's errors by type on each frozen test cohort (one representative run per task)
| Task and cohort | Items | Jev errors | Error types |
|---|---|---|---|
| Intent, CLINC150 test (repeat 1) | 1,000 | 121 (12.1%) | 69 wrong known intent; 41 missed out-of-scope requests (answered when they should have been refused); 11 false out-of-scope alarms (refused a supported request) |
| Sentiment, airline test (first round) | 1,000 | 157 (15.7%) | 53 negative → neutral; 44 neutral → negative; 24 neutral → positive; 17 positive → neutral; 15 positive → negative; 4 negative → positive |
| Sentiment, airline development (follow-up, repeat 1) | 2,142 | 331 (15.5%) | 198 of 331 are negative and neutral confused in either direction |
| Bank, same-distribution test (repeat 1) | 2,000 | 217 (10.8%) | 185 false negatives (missed subscribers, 82% of all subscribers); 32 false positives |
The errors are not random, and their shape suggests different remedies. On intent, the most frequent known-intent mistakes pair near-synonymous labels, such as reminder-update read as reminder (5), distance as directions (4), and change-ai-name and change-user-name confused in both directions (7). Those are partly schema problems that sharper label descriptions or merged labels could fix. On sentiment, most errors sit on the negative-neutral boundary, where the human annotators also disagreed most. On bank data the error is structural. Jev never flags a customer without a previous successful campaign, so the missed subscribers are missed every time, whatever the threshold.
Can Jev's confidence find its own errors?
Table 11. Error-detection AUC of Jev's top-label confidence (0.5 is no better than chance)
| Task | Cohort | Error-detection AUC |
|---|---|---|
| Intent | CLINC150 test, repeat 1 | 0.810 |
| Sentiment | Airline test, first round | 0.828 |
| Sentiment | Airline development, follow-up repeat 1 | 0.817 |
| Bank | Same-distribution test, repeat 1 | 0.512 |
On text, a wrong Jev answer gets a lower confidence than a right one about 81% to 83% of the time, which is the property selective classification needs. On bank data the ordering is a coin flip, and confidence stays between 0.52 and 0.99 whether the label is right or wrong. Figure 10 shows how the AUC is read.
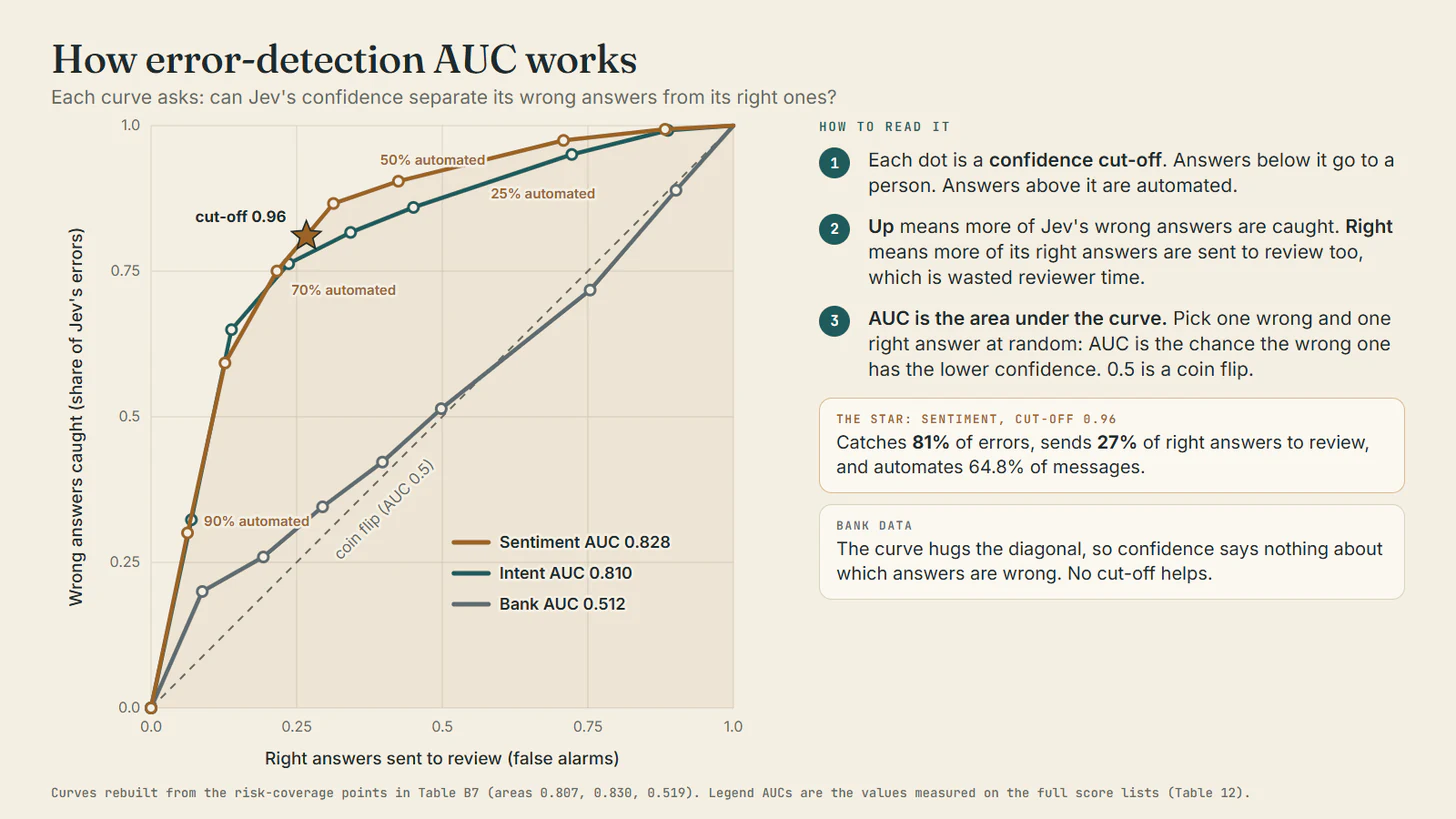
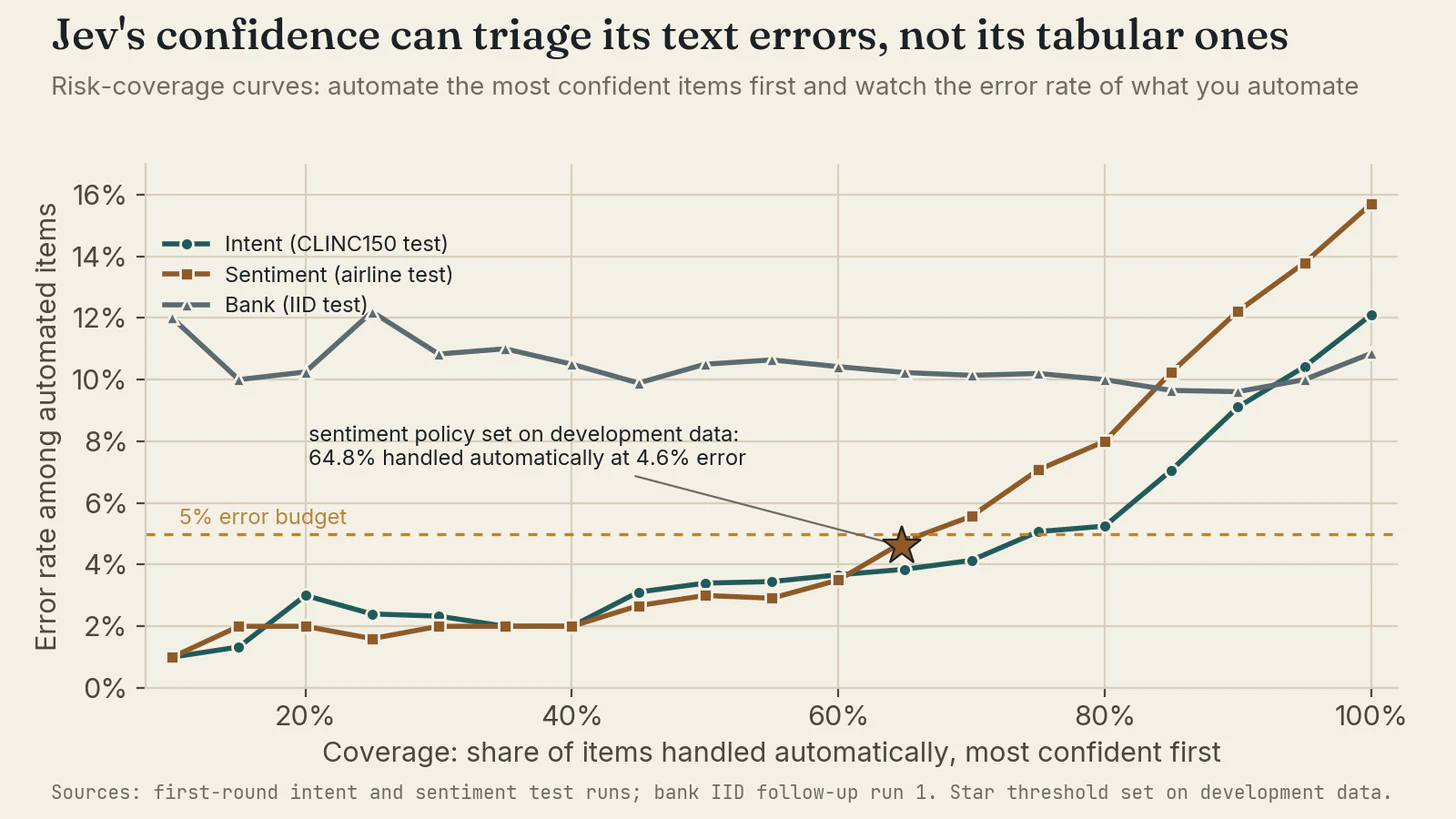
Table B7 has the numbers behind the curves.
An error budget, counted
Real counts make an error budget easy to see. Jev classified the sentiment of 1,000 airline messages it had not been tested on and got 157 wrong (15.7%). A team that trusted every answer would ship about one wrong answer in six without knowing which. So the team sets a budget before looking at any data: of the answers it acts on without a person checking, at most 5 in 100 may be wrong. On 2,142 different messages I found the lowest confidence cut-off at which the messages above it were wrong no more than 5% of the time. That cut-off was 0.96. Applied once to the new messages, everything at or above 0.96 is handled automatically and everything below goes to a person.
Table 12. What an error budget does to 1,000 new messages (sentiment, cut-off 0.96, budget 5%)
| Item | Messages | Jev wrong | Jev right |
|---|---|---|---|
| Confidence at or above 0.96: trusted without checking | 648 (64.8%) | about 30 (4.6% of 648) | about 618 |
| Confidence below 0.96: sent to a person | 352 (35.2%) | about 127 | about 225 |
| Total | 1,000 | 157 | 843 |
Read across the rows, the result has three parts. Sixty-five of every 100 messages need no human, and about 3 of those 65 are wrong, inside the 5% budget, so the cut-off chosen on practice data held on new data. Thirty-five of every 100 go to a reviewer, and that pile contains 127 of Jev's 157 mistakes (81%). The price is reviewer time: about a third of traffic gets a human look, and roughly 6 in 10 of the reviewed messages were already right.
Nothing in this design fixes errors automatically. The repair happens in the review lane, where a person keeps Jev's label where it was right and replaces it where it was wrong. The roughly 30 wrong answers in the automated lane go out as they are, which is what the 5% budget accepts, and a small random audit finds them afterwards. Every reviewed message is a labelled example, so over time those labels let a team train its own model, add it as a second opinion, and shrink the review lane.
The cut-off works like a dial. Raise it and fewer mistakes slip through, but more messages go to review. Lower it and reviewers do less, but more mistakes get through. The dial only works if confidence is lower when Jev is wrong. It held on text. It did not hold on the bank data, where every automated slice stayed about 10% wrong and the review pile was a random sample.
Once a team has its own trained model, it can send any message where the two models disagree to review as well. On the same 1,000 messages, DeBERTa disagreed with 44 of the 648 confident answers, and 11 of those 44 were Jev errors. That leaves 604 messages automated with about 19 wrong (3.1%) and raises error capture from 81% to 88%. Figure 12 shows both checks together.
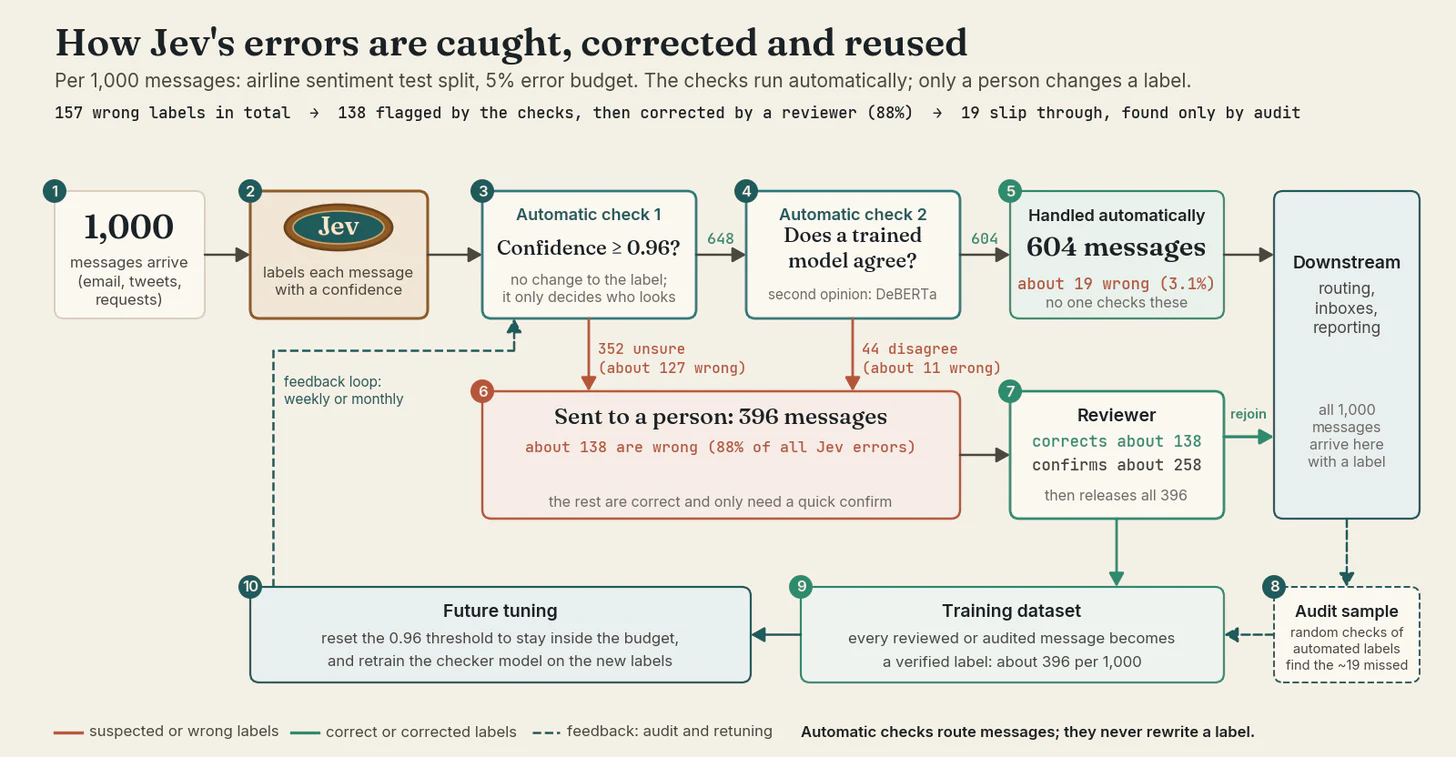
Triage policies under a 5% error budget
Each row is a rule for choosing which answers Jev handles alone. Read across: the share automated, how often those are wrong (the budget is 5%), and the share of mistakes sent to a person.
Table 13. Triage rules: how much Jev handles alone, how often it is wrong there, and how many mistakes reach a person
| Task | Rule for automating | Sent to a person, or handled aloneiGreen is handled by Jev alone, red goes to a person. More green saves work, but only if the error column stays near the 5% budget. | Of those sent to a person, wrong or rightiThe whole bar is the red lane from the previous column. Solid red is where Jev was wrong and a person fixes it; pale red is right answers a person only confirms. | Wrong among those handled aloneiLower is better. These mistakes go out unchecked. | Jev's mistakes sent to a personiHigher is better. It is the share of all wrong answers that a reviewer sees. |
|---|---|---|---|---|---|
| Sentiment | Confidence ≥ 0.96 (set on development split) | 648 alone · 352 to a person | about 127 wrong · 225 right | 4.6% [3.0%, 6.4%] | 81% |
| Sentiment | Jev agrees with DeBERTa (no cut-off) | 829 alone · 171 to a person | about 89 wrong · 82 right | 8.2% | 57% |
| Sentiment | Confidence ≥ 0.96 and agreement | 604 alone · 396 to a person | about 138 wrong · 258 right | 3.1% [1.8%, 4.5%] | 88% |
| Intent | Confidence at 5% budget (cross-fitted halves) | 754 alone · 246 to a person | about 82 wrong · 164 right | 5.0% (2.3% to 8.4%) | 68% |
| Intent | Jev agrees with DeBERTa (no cut-off) | 803 alone · 197 to a person | 100 wrong · 97 right | 2.6% | 83% |
| Intent | Confidence and agreement | 675 alone · 325 to a person | about 109 wrong · 216 right | 1.8% (0.6% to 3.1%) | 90% |
| Bank | Any confidence threshold (none meets the budget) | none alone · all 2,000 to a person | 217 wrong · 1,783 right | about 10% at every coverage level | 100% (nothing is separated) |
The sentiment policy held its budget prospectively. A threshold of 0.96, chosen on development data, automated 64.8% of the unseen test messages at 4.6% error. Adding the agreement check cut the automated error rate to 3.1% and captured 88% of errors. On intent, agreement with DeBERTa was the stronger single signal, and combining both left 1.8% error on two-thirds of traffic.
Table 14. Where Jev's mistakes end up under each policy
| Task and policy | Items | Handled automatically (of which wrong) | Sent to a person (of which wrong) | Share of Jev's mistakes caught for review |
|---|---|---|---|---|
| Sentiment, confidence ≥ 0.96 | 1,000 | 648 (about 30, or 4.6%) | 352 (about 127) | 81% |
| Sentiment, confidence ≥ 0.96 and agreement with DeBERTa | 1,000 | 604 (about 19, or 3.1%) | 396 (about 138) | 88% |
| Intent, agreement with DeBERTa | 1,000 | 803 (21, or 2.6%) | 197 (100) | 83% |
| Bank, most confident 65% automated | 2,000 | 1,300 (about 133, or 10.2%) | 700 (about 84) | 39% |
The first three rows show a triage signal doing its job: a minority of items goes to review, and that minority holds most of the mistakes. The bank row shows failure. Sending 35% of customers to review catches only 39% of the mistakes, and the automated lane keeps almost the error rate of automating everything.
The agreement check needs a trained model, and a trained model needs labels, so before any labels exist confidence is the only triage signal. Agreement becomes available once review has produced enough corrected labels.
What the evidence says
Where a zero-shot classifier earns its place
The pattern across the three tasks is consistent. Jev is strong where the label names and their descriptions carry most of the task, as in sentiment and in intent recognition with a clear fallback. It is weak where the signal lives in the joint distribution of many numeric and categorical fields, as in bank subscription.
That is a narrower claim than "Jev is as good as trained models", and a more useful one. The decision a technical leader faces is rarely which model is more accurate. It is what the first version costs and when training starts paying. A zero-shot classifier lets a team ship a defensible first version in hours and use its production traffic to collect the labels that will eventually replace or supervise it.
The vendor's calibration claim against the observed scores
TypeSafe describes Jev's outputs as carrying calibrated probabilities (TypeSafe AI, 2026). Calibration means a stated confidence of 0.8 is right about 80% of the time, which is separate from accuracy (Guo et al., 2017). I could not confirm it in these settings. On intent, 435 of 1,000 rows carried a single non-zero class score and score vectors summed to between 0.99 and 1.00, so I did not compute calibration error (Table B8). On bank data, Jev's confidence ranked customers at AUC 0.528 to 0.534, close to random, even though its labels were consistent. An independent test on Banking77 also found overconfidence, at 88% average confidence against roughly 80% accuracy (MindStudio, 2026). A confidence value that does not rank cases cannot safely drive a threshold, a routing policy or a contact budget. Until a calibration study says otherwise, I would use Jev's label, and its score only where I have checked that it ranks Jev's own errors.
Fair comparison is the main lesson
The largest effect in this study was not a model effect. It was the effect of giving each model an equal chance. A zero-shot model arrives with its effort already spent in the prompt and the label descriptions. A trained model needs its threshold, class weights and validation data before it is finished, and comparing a finished model with an unfinished one is the most common way to produce a misleading win.
Make every model earn the same chances before you compare them.
The second lesson is to test the simplest rule. A single poutcome == success check reproduced Jev's bank predictions on 99.9% of same-distribution rows. Without that baseline, a macro-F1 of 0.605 would have read as genuine discrimination. With it, Jev found the obvious rule and did nothing beyond it.
What I would do if I owned the decision
For a CTO or engineering lead, the evidence points to a staged policy rather than a model choice.
- Start with zero-shot where the labels explain the task. For routing, triage and sentiment-style decisions on text, a model like Jev can reach the accuracy of a fine-tuned small transformer without a labelling project, and its repeatability simplifies monitoring.
- Write the error budget per error type, with its cost, before choosing a threshold. A missed out-of-scope request, a refused supported request and a missed subscriber cost different amounts. The budget decides the threshold, never the reverse.
- Fix the threshold on validation data and freeze it. The sentiment policy held its budget because I chose the threshold before the test set was touched.
- Give the review lane an owner. Low-confidence items go to a person and, once a trained comparator exists, so do items where the two models disagree. A review lane needs a service level and a budgeted queue, so the coverage number is a staffing number.
- Give every waiting item a safe default, such as a generic reply or a "needs review" status, and make it the answer when review capacity runs out.
- Audit the automated lane. Label a random weekly sample of automated decisions and compare its error rate with the budget. Errors hide where nobody looks.
- Fix schema-level errors at the schema. Sharper descriptions or merged labels remove near-synonym errors for every future item, which no threshold can do.
- Turn every correction into a label, and measure the crossover. Re-run the comparison each time the label pool doubles, on a frozen recent holdout with rule baselines, and switch or ensemble when the trained model clears Jev by a margin you set in advance. On the bank data, 500 labels changed the answer.
The bank result marks the boundary. When confidence carries no error signal, triage by confidence is theatre: the review lane receives a random sample and the automated lane keeps its full error rate. The only defensible options are to accept the known error rate, to add a signal that carries information, such as a trained model or a business rule, or not to automate.
At board level, the finding has a short form. The zero-shot model buys speed to a first version and a stream of labelled data, and the trained model buys accuracy once that stream is large enough. Ask for the error rate in records, not percent, and ask who reads the ones that go to review. The risk worth pricing is never measuring the crossover.
Limits
- Contamination. All three datasets are public and widely copied. If Jev's underlying model saw them during pre-training, its scores overstate its ability on unseen data (Sainz et al., 2023). The bank behaviour fits either a sound domain prior or memorisation, and this design cannot separate the two. I ran no memorisation probe and no never-published test set.
- One dataset per task. Each conclusion rests on one corpus. The intervals measure sampling of test rows within it, not how a ranking would change on another dataset in the same domain.
- Reused test cohorts. The CLINC150 and first-round bank cohorts had been examined before the follow-up runs, so even the development-selected intent thresholds were applied to a known test set.
- Incomplete repeats. The sentiment follow-up completed three of five planned tuned DeBERTa seeds, and the reconstructed intent models did not reproduce the original probabilities exactly.
- Forward evaluation without timestamps or customer IDs. "Forward" means file order, and repeat customers could appear on both sides of a boundary.
- Error analysis added after the fact. Only the sentiment threshold was chosen on data separate from the test set. The error-detection AUCs use one representative Jev run per task, and sentiment "errors" include messages on which the human annotators themselves disagreed.
- Analysis status. The bank refits, learning curve and fixed-budget results were computed after the Jev calls from frozen cohorts, reproducibly but without audited run-artifact status.
What I would test next
The error analysis shows the idea works on text. It does not yet give a result I would publish as a guarantee, so two experiments are next.
Experiment 4: selective classification and human review. It would test, prospectively, whether a zero-shot classifier with a frozen triage policy keeps a stated error budget on unseen data, how much review work that costs, and whether the same policy does better on a trained model. Each task gets a calibration split, a test split and a fresh audit sample that overlap no cohort examined here, and budgets of 2%, 5% and 10% each get their own frozen threshold. Estimating a 5% selective risk to within ±1.5 points needs about 810 automated items, so at 65% coverage at least 1,250 test items per task. Two blind reviewers would read 200 items from each review lane and record minutes per item and how often they disagree. A policy passes if the upper 95% bound of its selective risk is within 1.5 points of the budget at coverage of at least 50%. If no Jev policy passes, Jev is not deployed unassisted for that task, and bank data serves as the negative control.
Experiment 5: contamination and fresh-data transfer. This one separates Jev's ability from any memory of public benchmarks. I would give Jev 200 test texts from each benchmark with their final 40% removed and compare accuracy against paraphrases, since a large drop signals memorisation. I would then apply the Experiment 4 policies, with frozen thresholds, to at least 1,000 never-published items labelled by two people. A macro-F1 drop above 5 points, or a breach of the error budget, would mean these results overstate Jev on new data.
A checklist before you deploy a zero-shot classifier
The procedure that finally produced trustworthy numbers is short enough to reuse.
- Freeze one test cohort per task and score every contender on exactly those IDs.
- Give the trained comparators the same care the zero-shot prompt received: class weights, a decision threshold, and hyperparameters chosen on validation data only.
- Put the majority-class baseline and the best one-line rule in every table.
- Report ranking metrics and precision and recall at fixed budgets, not only macro-F1 at one threshold.
- Repeat stochastic contenders: three zero-shot repeats and three to five training seeds.
- Use paired intervals for every contrast.
- Check confidence scores against outcomes, and draw the risk-coverage curve before choosing any threshold.
- Classify every error by type and cost, and fix the error budget before you see the test set.
- Test on data the provider cannot have seen, and forward in time if the data has a calendar.
- Keep failures as evidence, and label every AI-assisted review for what it is.
Conclusion
Jev is a credible zero-shot classifier. It matched a tuned DeBERTa-v3-small on airline sentiment with no labelled training data, refused out-of-scope requests better than thresholded trained models under a policy I set in advance, and repeated itself almost perfectly.
It is also wrong on a predictable share of what it sees, 11% to 16% in these tests. On text, its confidence can find most of those errors and route them to a person before they act. On a table of customers it cannot. That makes the error-handling design, not the model choice, the part of a deployment that most needs engineering.
It does not replace labels where labels exist. On every task, a trained model given the labels already available matched or beat Jev on the primary metric, and on the bank data about 500 labels were enough to pass it.
The question I would take to a board is not zero-shot or trained. It is how quickly a zero-shot first version can produce the labels that let a trained model take over, and how a team will know when it has. The team that measures that crossover gets both the speed and the accuracy. The team that argues about the model gets neither.
Appendix A. References
Awan, A. A. (2026, September 21). What everyone is getting wrong about TypeSafe AI's Jev. KDnuggets. kdnuggets.com
Chow, C. K. (1970). On optimum recognition error and reject tradeoff. IEEE Transactions on Information Theory, 16(1), 41–46. doi:10.1109/TIT.1970.1054406
CrowdFlower. (2015). Twitter US airline sentiment (Version 4) [Data set]. Kaggle. kaggle.com
Geifman, Y., & El-Yaniv, R. (2017). Selective classification for deep neural networks. In Advances in Neural Information Processing Systems 30 (pp. 4878–4887). papers.nips.cc
Guo, C., Pleiss, G., Sun, Y., & Weinberger, K. Q. (2017). On calibration of modern neural networks. In Proceedings of the 34th International Conference on Machine Learning (pp. 1321–1330). PMLR. proceedings.mlr.press
He, P., Gao, J., & Chen, W. (2021). DeBERTaV3: Improving DeBERTa using ELECTRA-style pre-training with gradient-disentangled embedding sharing (arXiv:2111.09543). arXiv. arxiv.org
Hendrycks, D., & Gimpel, K. (2017). A baseline for detecting misclassified and out-of-distribution examples in neural networks. In International Conference on Learning Representations. arxiv.org
Larson, S., Mahendran, A., Peper, J. J., Clarke, C., Lee, A., Hill, P., Kummerfeld, J. K., Leach, K., Laurenzano, M. A., Tang, L., & Mars, J. (2019). An evaluation dataset for intent classification and out-of-scope prediction. In Proceedings of EMNLP-IJCNLP 2019 (pp. 1311–1316). aclanthology.org
Laurer, M., van Atteveldt, W., Casas, A., & Welbers, K. (2023). Building efficient universal classifiers with natural language inference (arXiv:2312.17543). arXiv. doi:10.48550/arXiv.2312.17543
Maio, A. (2026, September 15). Jev: The language model that won't talk. Anthony Maio (Substack). substack.com
MindStudio. (2026, September 20). Jev vs BERT and zero-shot NLI: What the benchmarks actually show. MindStudio Blog. mindstudio.ai
Moro, S., Cortez, P., & Rita, P. (2014). A data-driven approach to predict the success of bank telemarketing. Decision Support Systems, 62, 22–31. doi:10.1016/j.dss.2014.03.001
Saerens, M., Latinne, P., & Decaestecker, C. (2002). Adjusting the outputs of a classifier to new a priori probabilities: A simple procedure. Neural Computation, 14(1), 21–41. doi:10.1162/089976602753284446
Sainz, O., Campos, J., García-Ferrero, I., Etxaniz, J., Lopez de Lacalle, O., & Agirre, E. (2023). NLP evaluation in trouble: On the need to measure LLM data contamination for each benchmark. In Findings of the Association for Computational Linguistics: EMNLP 2023 (pp. 10776–10787). doi:10.18653/v1/2023.findings-emnlp.722
TrueFoundry. (2026, September 18). TypeSafe AI's Jev and "System One models": What actually shipped. TrueFoundry Blog. truefoundry.com
TypeSafe AI. (2026, September 15). Introducing System One models and Jev. TypeSafe AI Blog. typesafe.ai
UCI Machine Learning Repository. (2014). Bank marketing [Data set]. University of California, Irvine. archive.ics.uci.edu
Appendix B. Supplementary data tables
Table B1. Intent, first-round results on the frozen 1,000-row test cohort
| Model | Regime; runs | Macro-F1 [95% CI] | Overall accuracy | Known-intent accuracy | Out-of-scope recall |
|---|---|---|---|---|---|
| Fine-tuned DeBERTa-v3-small | Supervised; 5 seeds | 0.914 [0.905, 0.926] | 86.7% | 96.7% | 41.8% |
| MiniLM + logistic | Supervised; 1 | 0.886 [0.873, 0.902] | 83.2% | 95.0% | 30.2% |
| Jev | Zero-shot; 3 repeats | 0.879 [0.862, 0.893] | 87.6% | 90.0% | 76.9% |
| TF-IDF + logistic | Supervised; 1 | 0.828 [0.811, 0.845] | 74.9% | 90.5% | 4.9% |
| fastText | Supervised; 1 | 0.780 [0.757, 0.801] | 72.5% | 84.6% | 18.1% |
| Local DeBERTa NLI | Zero-shot; 1 | 0.551 [0.519, 0.568] | 49.4% | 60.4% | 0.0% |
Table B2. Intent follow-up, retrospective recall-constrained thresholds (sensitivity only)
| Quantity | Five-seed DeBERTa mean | Jev (3 repeats) |
|---|---|---|
| Macro-F1 | 0.943 | 0.879 |
| Known-intent accuracy | 95.7% | 90.0% |
| Out-of-scope recall | 75.2% (seeds 65.9% to 80.8%) | 76.9% |
Table B3. Sentiment, first-round results on the frozen 1,000-message test cohort (one run per contender)
| Model | Macro-F1 [95% CI] | Accuracy | Negative / neutral / positive recall | Gate |
|---|---|---|---|---|
| Jev, zero-shot | 0.795 [0.761, 0.826] | 84.3% | 0.910 / 0.675 / 0.795 | Pass |
| Fine-tuned DeBERTa-v3-small | 0.784 [0.750, 0.815] | 83.7% | 0.918 / 0.641 / 0.769 | Fail (neutral) |
| MiniLM + logistic | 0.739 [0.703, 0.772] | 80.6% | 0.917 / 0.584 / 0.654 | Fail |
| fastText | 0.702 [0.662, 0.740] | 78.2% | 0.910 / 0.522 / 0.609 | Fail |
| TF-IDF + logistic | 0.692 [0.650, 0.731] | 78.8% | 0.967 / 0.450 / 0.513 | Fail |
| Local DeBERTa NLI | 0.602 [0.563, 0.639] | 74.8% | 0.894 / 0.172 / 0.923 | Fail |
Table B4. Bank, first-round cohort (1,200 rows, 38.4% subscribers): registered arms and repairs
| Arm | Macro-F1 [95% CI] | ROC AUC | Precision / recall | Flag rate |
|---|---|---|---|---|
| Jev, row only | 0.618 [0.589, 0.646] | 0.631 | 0.703 / 0.334 | 18% |
| Rule: last campaign succeeded | 0.621 [0.592, 0.650] | n/a | 0.696 / 0.343 | 19% |
| Rule: contacted before | 0.627 [0.599, 0.655] | n/a | 0.676 / 0.367 | 21% |
| Registered random forest | 0.484 [0.457, 0.509] | 0.524 | 0.401 / 0.688 | 66% |
| Registered logistic regression | 0.409 [0.384, 0.434] | 0.587 | 0.394 / 0.861 | 84% |
| Registered gradient boosting | 0.381 [0.381, 0.381] | 0.534 | 0 / 0 | 0% |
| Logistic, refit with development labels | 0.641 [0.614, 0.669] | 0.675 | 0.559 / 0.557 | 38% |
| Random forest, refit with development labels | 0.544 [0.515, 0.572] | 0.685 | 0.653 / 0.213 | 12% |
Table B5. First-round bank arms at the equal alert budget of Jev's 18.3% flag rate (1,200-row cohort)
| Arm | Macro-F1 difference vs Jev at equal budget [95% CI] | ROC AUC difference vs Jev [95% CI] |
|---|---|---|
| Registered random forest | −0.144 [−0.186, −0.100] | −0.107 [−0.158, −0.055] |
| Registered logistic regression | −0.107 [−0.144, −0.064] | −0.044 [−0.092, +0.004] |
| Registered gradient boosting | −0.133 [−0.171, −0.097] | −0.097 [−0.143, −0.050] |
| Logistic, refit with development labels | −0.049 [−0.076, −0.019] | +0.044 [+0.008, +0.081] |
| Random forest, refit with development labels | −0.016 [−0.035, +0.002] | +0.054 [+0.019, +0.090] |
Table B6. Bank forward track, recent-history sensitivity (origin-mean macro-F1)
| Supervised family | All history | Most recent 20% of history |
|---|---|---|
| Logistic regression | 0.516 | 0.449 |
| Random forest | 0.485 | 0.543 |
| Gradient boosting | 0.500 | 0.509 |
Table B7. Risk-coverage data behind Figure 11 (error rate among the most confident share of items)
| Coverage | Intent | Sentiment | Bank |
|---|---|---|---|
| 10% | 1.0% | 1.0% | 12.0% |
| 25% | 2.4% | 1.6% | 12.2% |
| 50% | 3.4% | 3.0% | 10.5% |
| 60% | 3.7% | 3.5% | 10.4% |
| 70% | 4.1% | 5.6% | 10.1% |
| 80% | 5.3% | 8.0% | 10.0% |
| 90% | 9.1% | 12.2% | 9.6% |
| 100% | 12.1% | 15.7% | 10.8% |
Table B8. Jev score and label diagnostics
| Setting | Label repeatability | Agreement with simplest rule | Confidence ranking (AUC) |
|---|---|---|---|
| Intent, 3 repeats | 98.6% of rows identical across all three | not applicable | not computed (sparse score vectors) |
| Sentiment follow-up, 3 repeats | 98.5% to 98.7% pairwise | not applicable | not computed |
| Bank same-distribution, 3 repeats | 100% identical labels | 1,998 / 2,000 rows | 0.528 to 0.534 |
| Bank forward, 3 repeats × 5 origins | identical at most origins; macro-F1 range 0.608 to 0.622 at origin 90% | 100%, 100%, 100%, 99.9%, 97.6% | 0.387, 0.501, 0.519, 0.548, 0.662 |
notes
Follow the work
More field notes on retrieval systems, evidence, and supervised AI engineering.